06 of 07
Disaster management using advanced analytics
Risk maps and population-movement analytics that let agencies position resources before a storm makes landfall.
What it is
Imagine this:
A typhoon is forming off the coast of the Philippines, projected to sweep across communities that have faced devastation time and time again. But this time, something is different. We already know the socioeconomic makeup of these communities. We know which neighbourhoods are home to the most vulnerable families, the elderly, and those with the fewest resources to cope.
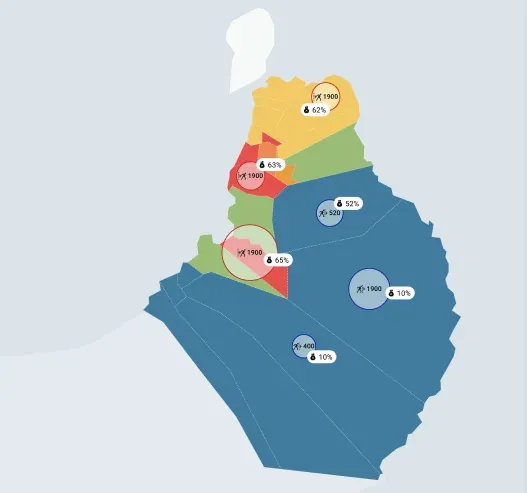
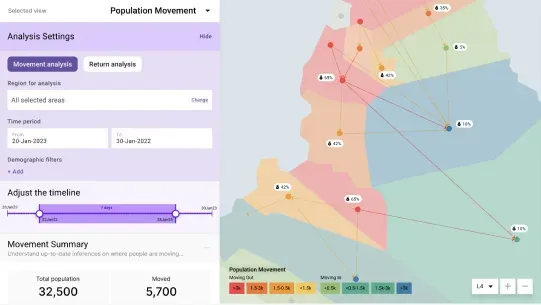
As the typhoon approaches, we can track in real time how people are moving. We can see which areas are being evacuated and where help is most urgently needed. This insight transforms the way we respond. Rescue teams can prioritise the hardest-hit regions, ensuring those who need help most aren’t left behind. Chaos is replaced with coordinated action, fuelled by timely data.
After the storm passes, restoration begins. We have a clear picture of how communities were impacted, allowing aid to be targeted effectively to rebuild homes, restore livelihoods, and bring hope to those who have lost the most. This is the power of advanced analytics in disaster management: turning uncertainty into informed action, and ensuring no one is forgotten.
This project is about using advanced analytics for empowering humanitarian organisations and governments to anticipate, plan, and respond with empathy and precision.
The problem
Across the region, natural disasters kill people every year who did not need to die. The data usually exists. The people making the decisions can’t get to it, read it, or act on it fast enough. The working tools are spreadsheets, radio and experience.
What I did
I was the lead designer. I worked with the key stakeholders to understand the process they had and where it broke down, through multi-day workshops and focus group discussions. I designed the interface and validated it with the people who would use it.
I also told the data science team what the coordinators actually needed, so they could work out which data would answer it and what insights to produce.
How it works
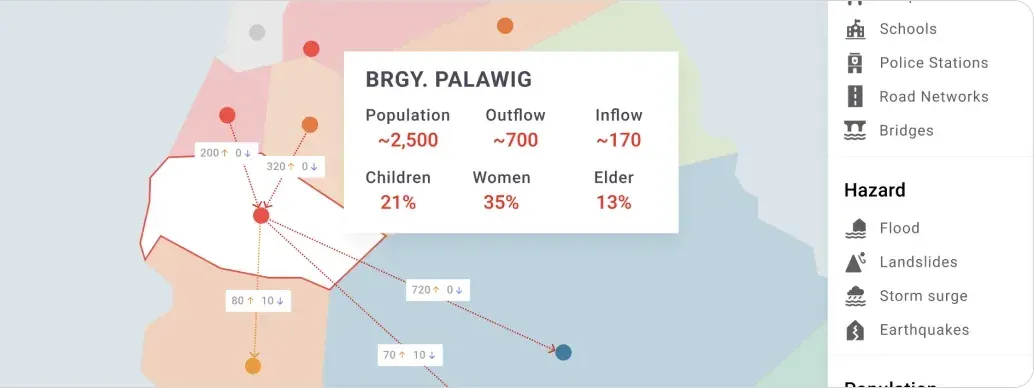
The platform pulls real-time streams into one coordinated view (weather forecasting models, satellite imagery, road and shelter capacity, and historical disaster records) and uses them to identify likely impact zones and prioritise evacuation corridors.
The design problem was compression. A local government officer, under extreme stress, possibly on a degraded network, has to be able to act on it in seconds.
Information architecture
Built around the decision windows that actually matter to a coordinator: preparing before landfall, responding in the first hours, and coordinating recovery afterwards. Each one needs a different view of the same data.
More detail on this project can be shared in an interview or portfolio review.